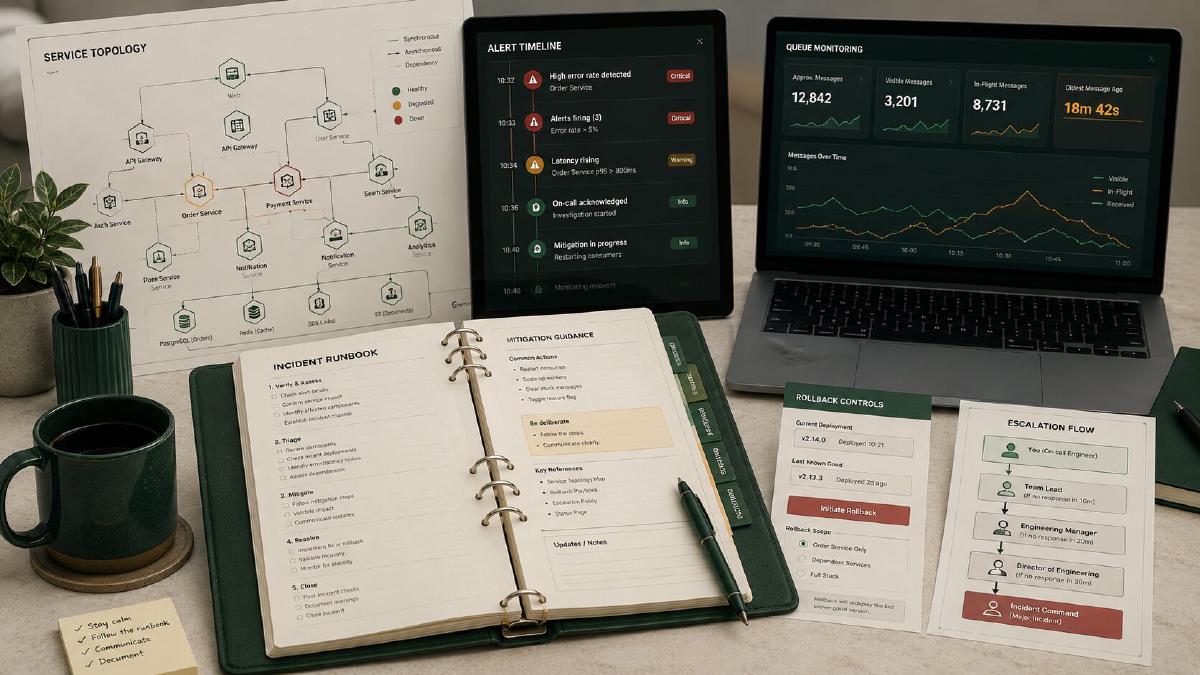
A production runbook is not supposed to prove how much the author knows about a system.
It is supposed to help someone else restore that system when it is failing.
That distinction matters.
I have seen operational documentation that was technically accurate but practically useless. It described the architecture, listed a few dashboards, and included vague instructions such as:
Check the logs and restart the service if necessary.
That is not a runbook.
A useful runbook helps an engineer answer five questions quickly:
- What is this service responsible for?
- How do I know what is failing?
- What can I safely do about it?
- How do I undo a bad change?
- When should I stop troubleshooting and escalate?
The engineer reading it may not be the person who built the service. They may have been pulled into an incident because the primary owner is unavailable. They may be tired, under pressure, and working with incomplete information.
The runbook has to work under those conditions.
In this guide, I will build a fictionalized runbook for an e-commerce service called the Order Processing Service. The service receives validated orders, sends them to an ERP, records processing status, and publishes fulfillment events to downstream systems.
The exact technology is less important than the structure. The same approach works for APIs, background workers, queue consumers, internal platforms, scheduled jobs, and customer-facing applications.
What a Production Runbook Is Actually For#
A production runbook is an operational recovery document.
It is not:
- A replacement for architecture documentation.
- A complete history of the service.
- An onboarding guide.
- A dumping ground for every command anyone has ever used.
- An excuse to leave recurring failures unresolved.
A good runbook exists to reduce the time between alert and safe recovery.
That means it should optimize for:
- Fast orientation.
- Clear diagnostics.
- Safe actions.
- Explicit rollback steps.
- Known limits.
- Escalation before the situation gets worse.
I think of the runbook as the operational interface to a service.
The application may expose an HTTP API to other systems, but the runbook is the interface exposed to the engineers responsible for keeping it alive.
If that interface is confusing, incomplete, or outdated, the service is harder to operate than it needs to be.
A Runbook Is a Temporary Bridge to Automation#
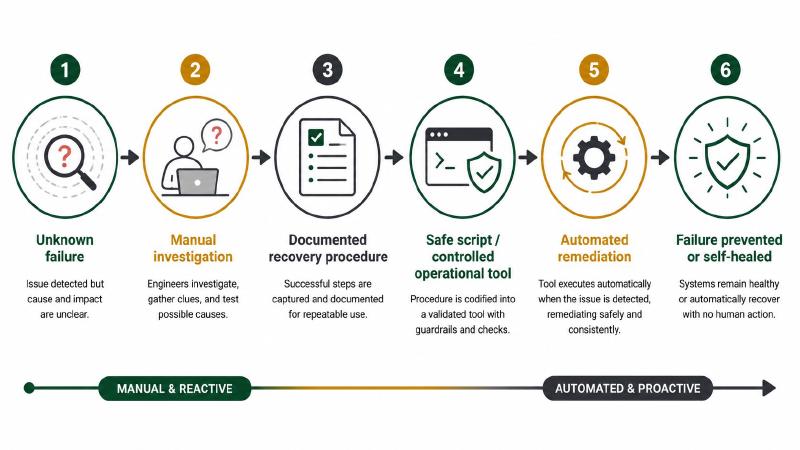
I do not consider a runbook the final solution to a recurring production problem.
If an engineer has to execute the same recovery sequence repeatedly, that recovery path should eventually become automation.
The progression should usually look like this:
| |
The runbook is still valuable throughout that process.
Before automation exists, it gives engineers a consistent recovery path.
After automation exists, it explains:
- What the automation does.
- When it should be used.
- What conditions prevent it from running.
- What to inspect when it fails.
- How to recover manually if necessary.
The mistake is allowing the runbook to become permanent justification for operational toil.
A section titled “Restart these six services every Tuesday” should not survive indefinitely. It should create an engineering task.
Every frequently used manual procedure is evidence of missing automation, insufficient resilience, or an unresolved design problem.
The Scenario: A Fictional Order Processing Service#
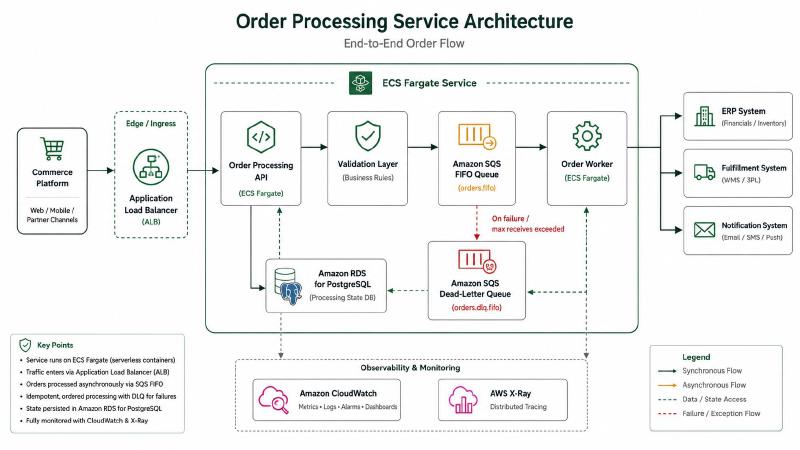
For this example, the fictional service has the following responsibilities:
- Receive order events from the commerce platform.
- Validate required order data.
- Publish valid orders to an Amazon SQS FIFO queue.
- Send queued orders to an ERP.
- Record the ERP response.
- Publish shipment-ready events to downstream systems.
The simplified flow looks like this:
| |
The service runs in AWS and uses:
- Amazon ECS on Fargate.
- Application Load Balancer.
- Amazon SQS FIFO.
- Amazon RDS for PostgreSQL.
- AWS Secrets Manager.
- Amazon CloudWatch.
- AWS X-Ray.
- CloudWatch alarms.
- A dead-letter queue.
- A CI/CD deployment pipeline.
This gives us enough complexity to demonstrate a real runbook without tying the article to a specific production environment.
The Most Important Rule: Write for the Least-Informed Qualified Engineer#
A runbook should assume the reader is technically capable but unfamiliar with the service.
That is different from writing for a beginner.
The engineer may understand AWS, Linux, HTTP, queues, containers, and databases. What they do not know is how this particular service behaves.
Do not assume they know:
- Which dashboard matters most.
- Which alarms are noisy.
- Which queue is safe to replay.
- Which database table records processing state.
- Whether restarting a worker creates duplicate orders.
- Whether a rollback also requires a schema rollback.
- Whether the ERP is allowed to be unavailable for an hour.
- Which team owns the upstream or downstream dependency.
The runbook should supply the service-specific knowledge that cannot be inferred from general engineering experience.
Start With a Fast Operational Summary#
The first screen of the runbook should orient the engineer.
Do not begin with three pages of history.
Start with:
- What the service does.
- How critical it is.
- What customers experience when it fails.
- Where it runs.
- Who owns it.
- The first dashboard to open.
- The first safe action to consider.
A useful header might look like this:
| |
This metadata can be displayed as Markdown rather than YAML, but the content should remain concise.
An engineer should understand the service within two minutes.
Service Overview#
The service overview explains what the system does and where its boundaries are.
It should not try to document every implementation detail.
Include the Business Function#
Start with the business responsibility:
The Order Processing Service receives paid orders from the commerce platform, validates required fulfillment data, and submits valid orders to the ERP. It tracks processing status and publishes downstream fulfillment events.
That sentence is more useful during an incident than:
The Order Processing Service is an event-driven microservice written in TypeScript.
The runtime and language matter, but the business function comes first.
During an outage, the engineer needs to understand what is at risk.
Define the Service Boundary#
Document what the service does not own.
For example:
| |
This prevents engineers from troubleshooting the wrong system.
It also makes escalation clearer.
Document Criticality#
Define the operational tier.
For example:
| Tier | Meaning |
|---|---|
| Tier 1 | Direct revenue, fulfillment, payment, or customer access impact |
| Tier 2 | Important internal capability with limited short-term customer impact |
| Tier 3 | Non-critical or deferrable workload |
The Order Processing Service would be Tier 1 because an extended outage stops fulfillment.
The runbook should also state how long the system can remain impaired before the impact becomes severe.
| |
These are operational expectations, not formal disaster recovery objectives unless the organization has defined them that way.
Architecture and Request Flow#
An engineer should not need to reverse-engineer the system during an incident.
Provide a simplified architecture diagram and a short request flow.
Keep the Diagram Operational#
The diagram should show:
- Entry point.
- Compute.
- Data store.
- Queues.
- External dependencies.
- Observability.
- Failure paths.
- Dead-letter behavior.
Avoid filling the diagram with implementation details that do not help recovery.
For this service:
| |
Explain the Normal Processing Sequence#
A numbered sequence is often easier to use than a paragraph:
- The commerce platform publishes an order event.
- The API validates the payload.
- Invalid orders are rejected and recorded with a validation reason.
- Valid orders are stored with a
pendingstatus. - The service publishes the order to the FIFO queue.
- A worker consumes the message.
- The worker submits the order to the ERP.
- The service records the ERP result.
- The message is deleted after successful processing.
- Permanent failures are moved to the DLQ after the configured retry limit.
This gives the on-call engineer a mental model for tracing failures.
Dependencies#
Dependencies are often where incidents become confusing.
A service can be healthy while its upstream, downstream, or infrastructure dependencies are failing.
The runbook should identify each dependency and explain how its failure appears.
A dependency table works well:
| Dependency | Purpose | Failure Symptom | Health Check | Owner |
|---|---|---|---|---|
| Commerce Platform | Produces order events | No new messages arriving | Compare checkout volume to queue ingress | Commerce Team |
| SQS FIFO Queue | Buffers order processing | Oldest message age increases | Queue dashboard | Platform Team |
| PostgreSQL | Stores processing state | API errors, worker failures | RDS dashboard and application logs | Platform Team |
| ERP | Accepts fulfilled orders | Retries, timeouts, DLQ growth | ERP status endpoint and integration dashboard | ERP Team |
| Secrets Manager | Supplies credentials | Authentication failures at startup | ECS task logs | Platform Team |
| DNS and ALB | Routes API traffic | Health check failures or 5xx responses | ALB target health | Platform Team |
Document Failure Characteristics#
Not all dependency failures should trigger the same response.
For example:
| |
The runbook should teach the engineer how the dependency fails, not merely name it.
Dashboards and Signals#
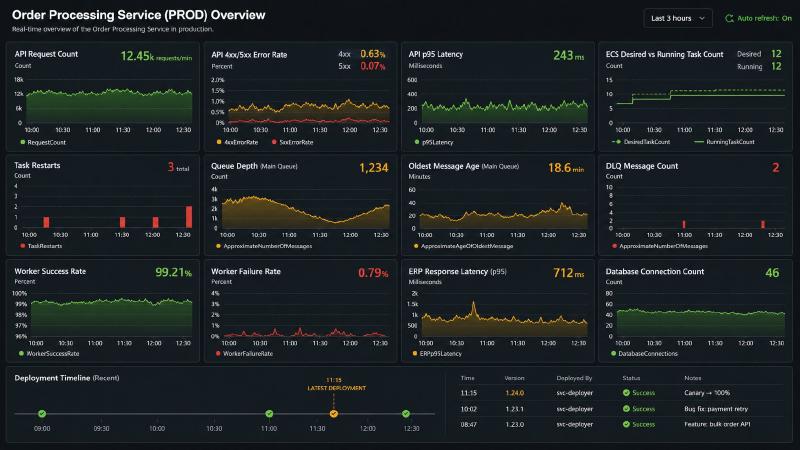
“Check CloudWatch” is not sufficient.
A useful runbook tells the engineer exactly which dashboard to open and what normal looks like.
Create a Dashboard Hierarchy#
I prefer three layers:
- Service overview
- Component detail
- Raw logs and traces
The overview dashboard should answer:
- Is the service available?
- Is traffic entering?
- Is work being processed?
- Is the backlog growing?
- Are errors increasing?
- Is a dependency failing?
For the fictional service, the main dashboard should include:
- API request count.
- API 4xx and 5xx rate.
- API latency.
- ECS desired and running task count.
- ECS task restarts.
- Queue message count.
- Oldest message age.
- DLQ message count.
- Worker success rate.
- Worker failure rate.
- ERP response latency.
- Database connection count.
- Database CPU and storage.
- Deployment marker.
Document Normal Ranges#
A dashboard is far more useful when the runbook explains expected behavior.
| |
The exact thresholds should reflect actual production behavior.
Do not invent arbitrary numbers because they look reasonable.
Document Correlated Signals#
One metric rarely tells the whole story.
For example:
| |
This kind of signal correlation is one of the most valuable parts of a runbook.
It captures practical operational knowledge that otherwise lives in one engineer’s head.
Logs and Traces#
The runbook should tell the engineer where logs live, how to filter them, and which fields matter.
Define Log Locations#
| |
Standardize Search Fields#
Structured logs are significantly easier to use during incidents.
A production event should ideally include fields such as:
| |
The runbook should explain which identifiers connect the workflow:
| |
Include Useful Queries#
For CloudWatch Logs Insights:
| |
To find ERP failures:
| |
To find a specific order:
| |
The engineer should not need to remember field names during the incident.
Common Failure Scenarios#
This is the core of the runbook.
Each scenario should follow the same structure:
- Symptoms.
- Likely causes.
- Confirmation steps.
- Safe remediation.
- Rollback or recovery.
- Escalation criteria.
- Follow-up work.
Consistency makes the document easier to scan.
API Returns Elevated 5xx Responses#
Symptoms#
- API 5xx rate exceeds the alert threshold.
- ALB target errors increase.
- Customers or upstream services report failed requests.
- ECS task restarts may be elevated.
Likely Causes#
- Bad application deployment.
- Database connection exhaustion.
- Missing or invalid secret.
- Dependency timeout.
- ECS tasks failing health checks.
- Application memory exhaustion.
Confirmation Steps#
- Check whether a deployment occurred near the start of the errors.
- Review ECS desired, running, and pending task counts.
- Inspect target health in the load balancer.
- Check API logs for the dominant error code.
- Review database connections and CPU.
- Confirm Secrets Manager access if tasks fail during startup.
Useful AWS CLI checks:
| |
Check unhealthy load balancer targets:
| |
Safe Remediation#
- If the failure began immediately after deployment, initiate the documented rollback.
- If database connections are exhausted, identify the source before scaling the API.
- If tasks cannot start because of a secret or permission failure, restore the previous task definition or credential configuration.
- If only a subset of tasks is unhealthy, allow ECS to replace them while watching capacity.
Do Not#
- Do not restart every task without identifying the failure.
- Do not scale the service aggressively if the database is already saturated.
- Do not rotate credentials during the incident unless credential failure is confirmed.
- Do not deploy unrelated changes.
Escalate When#
- The service remains impaired after rollback.
- Database health is degraded.
- A required secret or IAM permission changed unexpectedly.
- The upstream or downstream dependency is failing.
- Customer impact exceeds 15 minutes.
Queue Backlog Is Growing#
Symptoms#
- Queue depth rises continuously.
- Oldest message age exceeds the normal threshold.
- Order status remains
processing. - Workers may appear healthy while throughput declines.
Likely Causes#
- Worker concurrency is too low.
- ERP latency has increased.
- Workers are repeatedly retrying poison messages.
- Database writes are slow.
- A deployment reduced processing throughput.
- FIFO message grouping is causing a hot partition.
Confirmation Steps#
- Compare queue ingress and deletion rates.
- Check worker running task count.
- Review worker success and failure rates.
- Check ERP latency and error rate.
- Inspect the most common worker error.
- Check whether one
MessageGroupIddominates processing. - Review recent deployment markers.
Safe Remediation#
If workers are healthy and dependencies are stable:
| |
Only scale workers after confirming:
- The ERP can tolerate additional concurrency.
- The database has available connections.
- Messages are not failing repeatedly.
- The queue backlog is legitimate work rather than poison messages.
If ERP latency is elevated:
- Avoid increasing concurrency.
- Reduce retry pressure if necessary.
- Preserve messages in the queue.
- Escalate to the ERP team.
If a poison message is blocking a FIFO message group:
- Identify the affected message group.
- Confirm retry count.
- Allow the message to move to the DLQ according to policy.
- Do not manually delete it unless the business impact and replay implications are understood.
Escalate When#
- Oldest message age exceeds 30 minutes.
- Throughput remains below ingress after safe scaling.
- ERP errors exceed the defined threshold.
- Multiple message groups are blocked.
- DLQ volume is increasing.
Database Connection Exhaustion#
Symptoms#
- API or worker errors mention connection timeouts.
- RDS connection count approaches the maximum.
- Application latency increases.
- Task restarts may increase.
- Scaling the application makes the incident worse.
Likely Causes#
- Connection leak.
- Incorrect pool configuration.
- Sudden task count increase.
- Slow queries retaining connections.
- Database failover or degraded performance.
- A deployment changed connection behavior.
Confirmation Steps#
- Review RDS connection count.
- Check application task count.
- Compare the incident start time to recent deployments.
- Inspect slow query metrics.
- Check whether one service is consuming most connections.
- Review connection pool errors in application logs.
Safe Remediation#
- Stop further application scaling.
- Roll back a deployment that introduced the connection increase.
- Reduce worker concurrency if background processing is consuming the pool.
- Allow unhealthy tasks to drain rather than restarting everything simultaneously.
- Engage the database owner if active sessions need deeper inspection.
Do Not#
- Do not increase the database connection limit as the first response.
- Do not restart every application task at once.
- Do not scale out the API while connections are exhausted.
- Do not terminate database sessions without identifying their owners.
Follow-Up#
A recurring connection exhaustion incident should produce work such as:
- Fixing connection leaks.
- Correcting pool sizes.
- Introducing RDS Proxy.
- Adding per-service connection metrics.
- Adding load tests for deployment changes.
- Establishing task-count-aware pool limits.
ERP Is Unavailable#
Symptoms#
- ERP requests time out.
- Worker retry count increases.
- Queue depth and message age increase.
- DLQ messages may appear.
- API health may remain normal.
Immediate Objective#
Preserve orders without creating duplicates or overwhelming the ERP.
Confirmation Steps#
- Check ERP health from the integration dashboard.
- Confirm failures occur across multiple orders.
- Review ERP response codes and latency.
- Verify messages remain in the queue.
- Confirm the queue retention period.
- Contact the ERP owner.
Safe Remediation#
- Allow SQS to retain unprocessed orders.
- Reduce worker concurrency if retries are creating unnecessary load.
- Do not purge the queue.
- Do not manually resubmit orders outside the normal idempotent path.
- Monitor queue age against business impact thresholds.
- Restore normal concurrency gradually after ERP recovery.
Escalate When#
- ERP failure is confirmed across multiple requests.
- Oldest message age exceeds 15 minutes.
- Order fulfillment is materially delayed.
- The ERP team cannot provide a recovery estimate.
- Messages are approaching retention limits.
Dead-Letter Queue Is Growing#
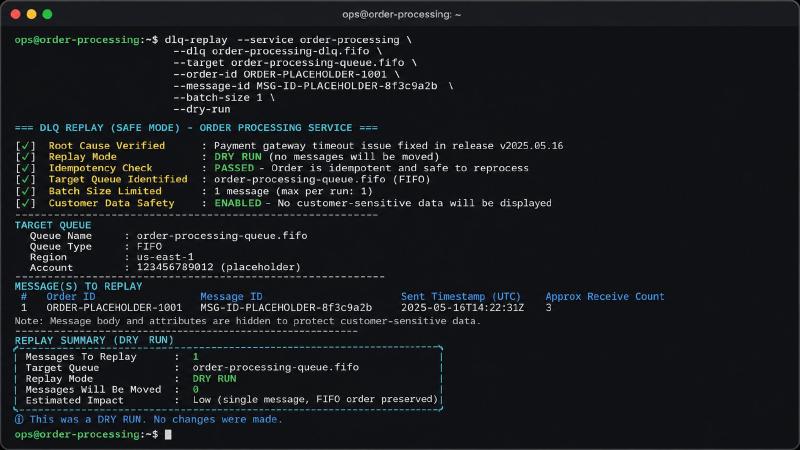
A DLQ is not a trash can.
Messages in the DLQ represent business events that failed beyond the normal retry policy.
Symptoms#
- DLQ alarm fires.
- Orders remain unresolved.
- The same validation or dependency error appears repeatedly.
Confirmation Steps#
- Record the DLQ message count.
- Sample a small number of messages.
- Group failures by error code.
- Determine whether the failure is transient or permanent.
- Confirm whether the underlying issue has been corrected.
- Verify replay is idempotent.
Safe Replay Requirements#
Replay should only occur when:
- The root cause has been fixed.
- The target system is healthy.
- The message has not already been processed manually.
- The consumer is idempotent.
- The replay batch size is controlled.
- The results will be monitored.
Example controlled replay command:
| |
A real replay tool should default to dry-run mode.
The runbook should explain exactly how to verify that replay will not create duplicate orders.
Do Not#
- Do not redrive the entire DLQ without sampling failures.
- Do not replay messages while the root cause is still active.
- Do not modify message contents manually unless there is an approved recovery procedure.
- Do not assume FIFO deduplication alone guarantees business idempotency.
Bad Deployment#
A production runbook should make rollback easier than improvisation.
Symptoms#
- Errors begin immediately after deployment.
- New tasks fail health checks.
- Latency increases after the release marker.
- A new error signature appears.
- The previous version was healthy.
Confirm the Deployment#
| |
Rollback Criteria#
Rollback should be the default when:
- Customer-impacting errors began immediately after deployment.
- The issue is not understood quickly.
- The previous version is known to be healthy.
- The rollback does not create a database compatibility problem.
Rollback Command#
| |
The runbook should not rely on an engineer guessing the previous task definition.
It should explain how to find it and how to verify it.
Verify the Rollback#
- Confirm the previous task definition is active.
- Confirm running task count returns to desired count.
- Check ALB target health.
- Confirm API error rate declines.
- Send a synthetic test request.
- Verify queue and database behavior.
- Watch the service for at least one normal processing cycle.
Database Compatibility Warning#
A deployment rollback may be unsafe if the release includes a non-backward-compatible schema migration.
The runbook should explicitly classify migrations:
| |
The safest deployment pattern is to make database changes backward-compatible across at least two application versions.
Rollback Must Be a First-Class Procedure#
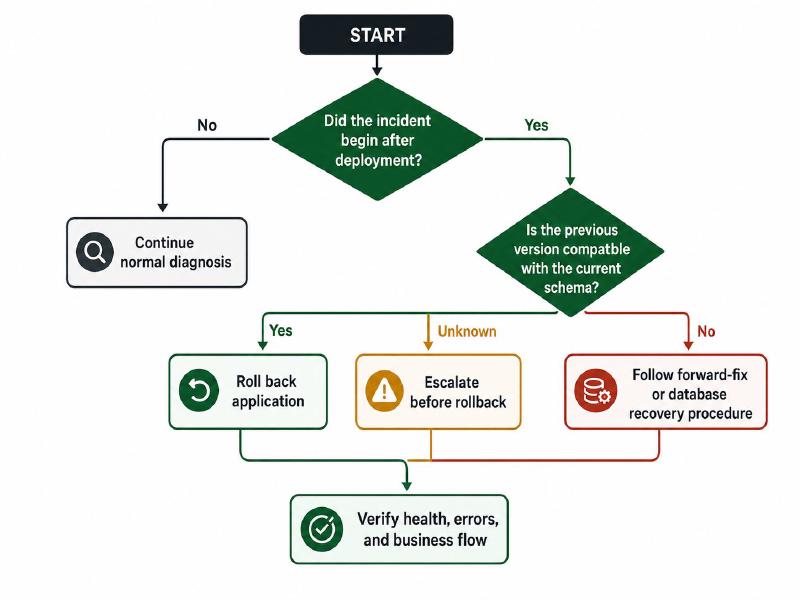
Many teams document deployment thoroughly and rollback poorly.
That is backwards.
The production runbook should answer:
- What is the rollback mechanism?
- Where is the last known-good version recorded?
- How long does rollback take?
- Does rollback affect data?
- Are schema changes compatible?
- Does configuration also need to be reverted?
- How is rollback verified?
- Who has permission to execute it?
A strong rollback section should include a decision tree:
| |
The engineer should not have to make a high-risk schema compatibility decision alone during an incident.
Escalation#
Escalation is not failure.
Knowing when to escalate is part of operating the system safely.
A weak runbook says:
Contact the service owner if needed.
A useful runbook defines specific triggers.
Example Escalation Matrix#
| Condition | Escalate To | Time Threshold |
|---|---|---|
| Customer-facing API unavailable | Incident Commander and Commerce Team | Immediately |
| Orders delayed more than 15 minutes | Commerce and Fulfillment | Immediately |
| ERP unavailable | ERP Team | After confirming cross-order failures |
| Database connections above 90% | Platform or Database Owner | Immediately |
| DLQ contains more than 10 messages | Service Owner | Within 10 minutes |
| Rollback fails | Platform Lead | Immediately |
| Potential duplicate order processing | Commerce, ERP, and Incident Commander | Immediately |
| Potential data loss | Engineering Leadership and Security | Immediately |
Include Contact Paths#
| |
Avoid putting personal phone numbers directly in a repository unless there is a clear reason and access is controlled.
Use team schedules, incident tooling, or on-call systems wherever possible.
Known Gotchas#
The known-gotchas section is where practical experience becomes extremely valuable.
These are the behaviors that repeatedly surprise engineers.
For the fictional service:
FIFO Ordering Can Hide a Localized Blockage#
One failed message can block later messages that share the same MessageGroupId.
A healthy overall consumer count does not prove every order group is progressing.
Scaling Workers Can Make Dependency Failures Worse#
More workers do not help when the ERP or database is the bottleneck.
Scaling concurrency during a dependency incident can increase retries, timeouts, and recovery time.
Restarting Workers Does Not Remove Poison Messages#
A malformed message will still be present after the worker restarts.
Repeated restarts only delay diagnosis.
DLQ Replay Can Create Duplicate Business Events#
Queue-level deduplication and application-level idempotency are not the same thing.
The service must verify whether the order has already been accepted by the ERP.
Oldest Message Age Is Often More Important Than Queue Depth#
A queue containing 10,000 messages may be healthy during a traffic spike if messages are draining quickly.
A queue containing 100 messages may be unhealthy if the oldest message has been waiting for an hour.
A Healthy API Does Not Mean Orders Are Processing#
The API and worker are separate components.
The customer-facing endpoint can be healthy while the background queue is stalled.
Deployment Rollback Does Not Automatically Revert Configuration#
Task definitions, feature flags, secrets, parameter values, and database migrations may change independently.
The rollback procedure must identify which layers are included.
This section should grow over time.
Every incident that exposes unexpected system behavior should either:
- Add a gotcha.
- Improve automation.
- Add an alert.
- Fix the design.
- Remove the failure mode entirely.
A Practical Runbook Template#
The following structure works well for most production services.
| |
This template is intentionally repetitive.
During an incident, predictable structure is more valuable than literary variety.
Make Every Command Safe to Copy#
Commands in runbooks are dangerous because engineers tend to trust them.
Every command should be reviewed as though someone will paste it into production while tired.
Use Explicit Environments#
Bad:
| |
Better:
| |
Use Read-Only Commands First#
Start diagnostic sections with inspection commands:
| |
Only then show commands that change production.
Add Preconditions#
| |
Include a Recovery Command#
If a command changes state, document how to reverse it.
| |
Avoid Destructive Commands#
A runbook should not casually include commands such as:
| |
If an operation is unusually destructive, it should require:
- Explicit approval.
- A separate controlled procedure.
- Clear auditability.
- Documented business impact.
- A recovery plan.
Link to Tools, Not Just Concepts#
A runbook should point directly to the operational resources.
Useful links include:
- Primary dashboard.
- Component dashboards.
- Log groups.
- Trace explorer.
- Deployment pipeline.
- Repository.
- Infrastructure code.
- Feature flag system.
- Queue console.
- DLQ console.
- Database dashboard.
- Incident channel.
- Service ownership directory.
- External dependency status page.
Avoid vague directions such as:
Open the AWS console and find the queue.
The runbook should name the queue and link to it.
The goal is to eliminate unnecessary navigation during the incident.
Test the Runbook Before You Need It#
A runbook is not complete because someone merged the Markdown file.
It is complete when another engineer can use it.
I would test it with someone who did not write the service.
Give them a fictional incident:
Order processing latency is increasing. The API is healthy, but the queue’s oldest message age has reached 25 minutes.
Then ask them to use only the runbook.
Watch for where they get stuck.
Common problems include:
- Missing permissions.
- Dead links.
- Commands that depend on undocumented environment variables.
- Dashboard names that no longer exist.
- Unclear rollback versions.
- Undocumented schema constraints.
- Escalation contacts that are outdated.
- Acronyms that only the original team understands.
- Procedures that rely on hidden knowledge.
A tabletop exercise will expose these problems before a real outage does.
Keep the Runbook Current#
An outdated runbook can be more dangerous than no runbook.
The engineer assumes the documented procedure is safe because it exists.
Runbooks should have ownership and review dates.
| |
Update the Runbook When#
- The architecture changes.
- A dependency changes.
- A new dashboard is introduced.
- An alert changes.
- Deployment or rollback changes.
- A new failure mode appears.
- An incident reveals a missing step.
- A manual recovery step becomes automated.
- Ownership changes.
Make Runbook Updates Part of the Work#
A service change is not operationally complete if it changes production behavior but leaves the runbook inaccurate.
The definition of done for a production change should include:
| |
Documentation should change alongside the service, not months later.
Turn Repeated Procedures Into Automation#
The runbook should identify which steps are temporary.
I like adding a small automation note to each failure scenario:
| |
Or:
| |
This keeps the runbook from becoming a museum of manual procedures.
Good Automation Candidates#
- Safe service restart.
- Worker scaling within limits.
- DLQ sampling.
- DLQ replay with idempotency checks.
- Deployment rollback.
- Credential validation.
- Synthetic health checks.
- Dependency status checks.
- Log collection.
- Incident timeline generation.
- Alert enrichment.
- Automated ticket creation.
Automation Should Be Safer Than the Manual Procedure#
A recovery script should include:
- Environment validation.
- Dry-run mode.
- Input validation.
- Maximum batch sizes.
- Permission checks.
- Confirmation for destructive actions.
- Audit logs.
- Clear exit codes.
- Idempotency.
- Rollback or compensating actions.
Bad automation only executes the wrong action faster.
What Engineers Actually Need During an Incident#
The engineer does not need a perfect explanation of the system.
They need a reliable path through uncertainty.
A useful runbook says:
| |
An unhelpful runbook says:
| |
The difference is operational specificity.
A Runbook Quality Checklist#
Before publishing a runbook, I would verify the following.
Orientation#
- Can an unfamiliar engineer explain what the service does?
- Is customer impact clear?
- Is the service owner obvious?
- Is the first dashboard easy to find?
Diagnosis#
- Are normal ranges documented?
- Are alerts explained?
- Are dependencies listed?
- Are common signal combinations explained?
- Are useful log queries included?
Recovery#
- Are procedures ordered?
- Are commands safe to copy?
- Are preconditions documented?
- Are destructive actions clearly marked?
- Can every state-changing action be reversed?
Rollback#
- Is the last known-good version identifiable?
- Is schema compatibility explained?
- Is rollback verification included?
- Are configuration changes covered?
Escalation#
- Are escalation conditions explicit?
- Are team channels current?
- Are severe data risks identified?
- Does the engineer know when to stop troubleshooting?
Maintenance#
- Is there a named owner?
- Is there a review date?
- Has another engineer tested it?
- Does every recurring manual step have an automation candidate?
The Bigger Operational Lesson#
A good runbook is evidence that a team understands its production system.
Writing one forces the team to answer uncomfortable questions:
- What does normal actually look like?
- Which metric tells us customers are affected?
- Can we roll back safely?
- Are our recovery commands tested?
- Do we know who owns every dependency?
- Can someone outside the core team operate the service?
- Which failures still depend on tribal knowledge?
- Which manual procedures should already be automated?
Those questions often reveal more than the document itself.
They expose weak observability, unclear ownership, unsafe deployments, missing idempotency, undocumented dependencies, and operational work that only one engineer knows how to perform.
That is why runbooks are useful beyond incident response.
They are a test of whether a production service is truly operable.
Final Thoughts#
The best production runbook is not the longest one.
It is the one an engineer can trust.
It explains the service without burying the reader in architecture history. It connects symptoms to likely causes. It provides safe diagnostic steps before remediation. It treats rollback as a normal operational capability. It defines escalation clearly. It captures the gotchas that would otherwise remain tribal knowledge.
Most importantly, it does not normalize repeated manual work.
The runbook should stabilize the service today while giving the team a clear path toward automating the recovery tomorrow.
A production system is not mature because its original author knows how to fix it.
It is mature when another qualified engineer can understand the failure, recover the service safely, and improve the system so the same procedure becomes less necessary next time.